

Meta Ads creative performance analysis should begin with the business outcome: purchase economics for ecommerce, and qualified leads or acquired customers for lead generation. Then use attention, clicks and funnel metrics to investigate why an ad is performing that way. Build your report at ad level, compare consistent dates and attribution settings, and keep conversion counts beside every rate. A high hook rate or low cost per lead cannot establish a winner on its own.
This guide gives business owners and media buyers a practical sequence: validate measurement, choose the right metrics, build three saved reporting views, calculate custom ratios and record a clear decision for each creative. It reflects Digi Amenity’s view that creative, offer, tracking, landing page and sales follow-up have to be assessed together.
Meta documentation checked on 5 October 2026. Menu labels, breakdowns and custom-metric fields vary by account and campaign setup. The examples below are hypothetical; they are not client results or a claim that a live account dashboard has been configured.
What should you check before judging a creative?
Write a short measurement contract before opening the leaderboard. Without one, a purchase campaign can be compared with a retargeting campaign, a lead can be counted twice, and yesterday’s incomplete revenue can make a useful ad look unprofitable.
- Define the outcome. For ecommerce, identify the purchase event, revenue basis and desired customer type. For lead generation, distinguish submitted, valid, contacted, qualified, attended and won.
- Validate the event. Check successful completion, browser/server duplication where both are used, currency, value and test-event exclusion. A button click is not a completed enquiry.
- Fix the comparison scope. Record objective, conversion location, audience type, country, placement, date range, timezone and attribution setting.
- Allow outcomes to mature. Use a reporting cutoff that suits purchase lag, qualification time and returns. Same-day figures are provisional.
- Record what changed. Promotions, stock, price, landing pages, sales staffing and tracking releases can explain performance changes that look like a creative effect.
Keep prospecting and retargeting separate initially. Keep website leads, instant-form leads and messaging enquiries in different views. They have different journeys and cannot be compared fairly through one generic “Results” column.
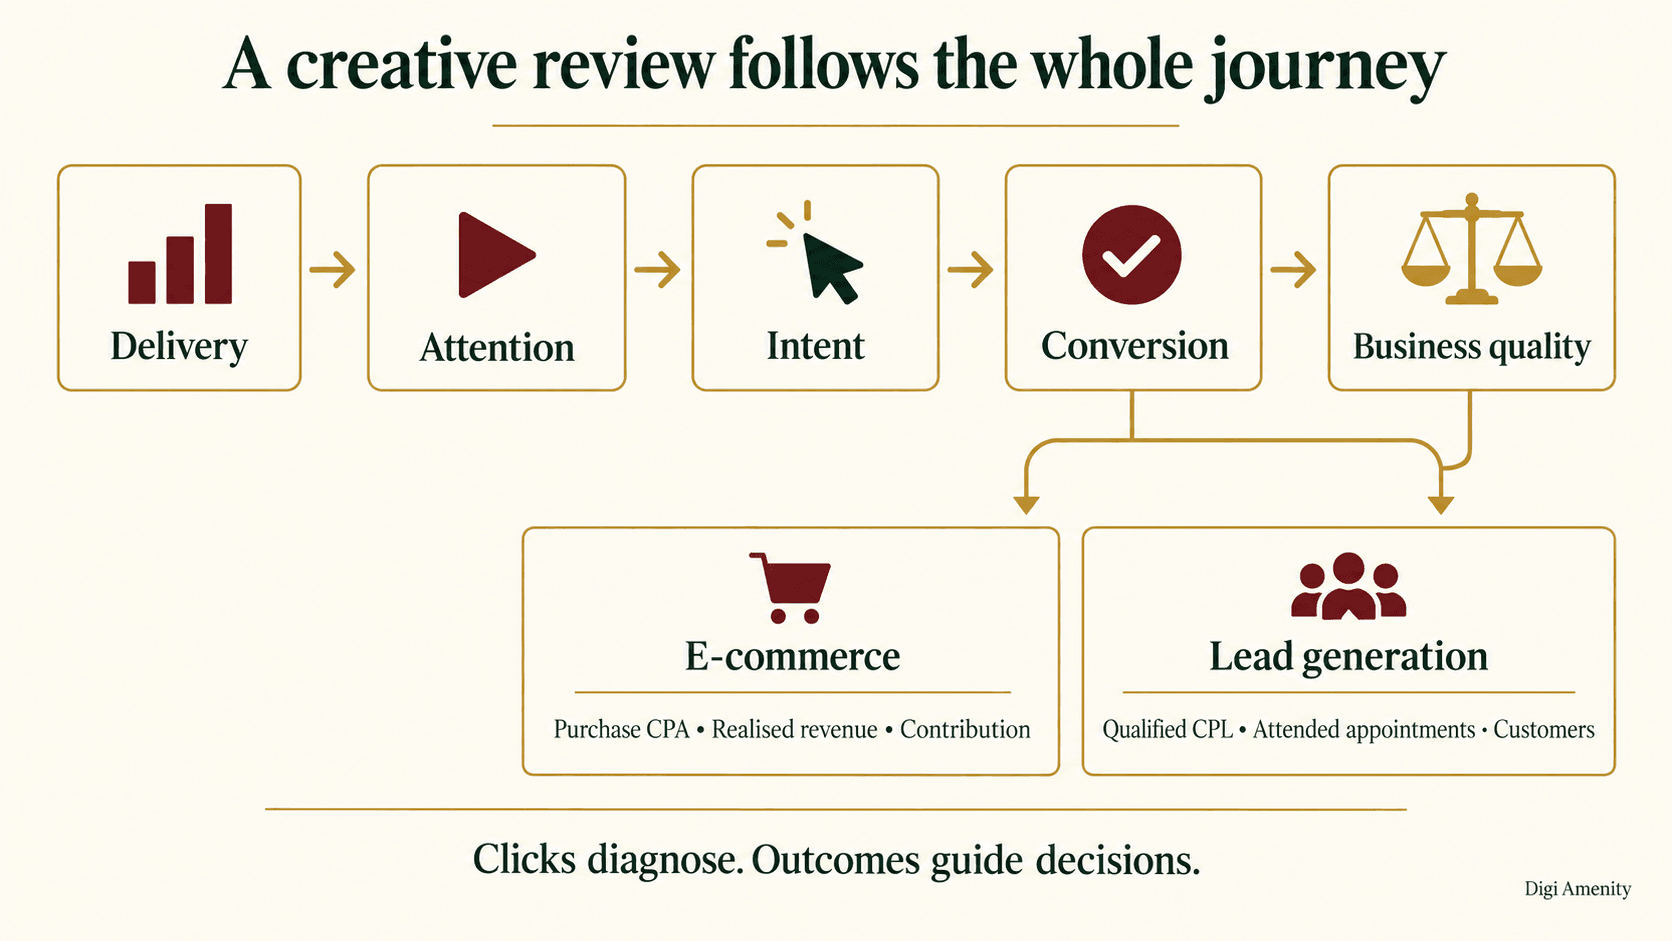
Which Meta Ads creative metrics explain the customer journey?
| Layer | Useful metrics | Question to answer |
|---|---|---|
| Delivery | Spend, impressions, reach, frequency, CPM, delivery status | Did this ad receive enough opportunity to evaluate? |
| Attention | 3-second plays, defined hook ratio, 15-second ThruPlays, average play time, video quartiles | Does the opening attract attention and does the message retain it? |
| Intent | Outbound clicks/CTR for websites; appropriate native form or messaging actions | Are people taking the next step relevant to this journey? |
| Destination | Landing page views, product/cart/checkout events or form opens | Where might expectation, loading or usability break down? |
| Outcome | Purchases, value, purchase CPA, scoped leads and CPL | What attributable results are being recorded? |
| Business quality | New customers, realised revenue, contribution, qualified leads, attended appointments, customers | Are the results commercially useful? |
Why are CTR, link CTR and outbound CTR different?
CTR (all) includes a broader range of ad interactions. Link clicks cover destinations or experiences on or off Meta; outbound clicks refer to links that take people outside Meta technologies. For a website-sales journey, outbound CTR is usually a more focused diagnostic than all-click CTR. It still does not prove that the page loaded or the visitor bought. For a native form or WhatsApp journey, use actions that match that destination instead of forcing an outbound-click funnel. See Meta’s click definitions.
How should hook rate and hold rate be interpreted?
Define the numerator and denominator explicitly. In this guide, Hook 3s = 3-second video plays ÷ impressions, and Hold 15s = 15-second ThruPlays ÷ 3-second video plays. These are diagnostic reporting ratios, not universal Meta quality scores or unique-person retention measures.
Meta now documents both 6-second and 15-second ThruPlay options. Do not silently substitute a generic or six-second field into a formula labelled “15s”. The 15-second metric includes near-completion for shorter videos. For a meaningful 3-to-15-second comparison, use videos at least 15 seconds long and comparable duration/placement groups. For shorter videos, label the ratio as short-video completion and analyse it separately.
Video ratios do not apply to static images. Use intent, business outcomes and a qualitative review of the image’s message and offer. A 50% video play also represents very different viewing time for a 10-second and a 60-second ad.
Which metrics matter for ecommerce creative analysis?
Start with website purchases, purchase CPA, website purchase conversion value and website purchase ROAS. Include spend and the number of purchases. Then inspect landing page views, add-to-cart and checkout events to identify possible friction.
Meta ROAS = attributed purchase value ÷ ad spend. It is not net profit. Reconcile it with store data for discounts, taxes where relevant to your accounting basis, cancellations, returns, fulfilment costs and new versus returning customers. An ad can look efficient because it reaches existing customers who were already likely to buy.
Create your allowable acquisition cost from business economics. In a hypothetical example, ₹2,000 of net revenue less ₹1,300 in variable product and fulfilment costs leaves ₹700 before advertising. If the business wants ₹100 remaining contribution, its illustrative ad-cost allowance is ₹600 per order. This is an operating target, not an industry benchmark, and it requires the same revenue/cost basis in the reporting.
For a first-order decision, do not add speculative lifetime value to justify a loss. If repeat purchase value is used, show the actual cohort evidence and payback assumption separately. For COD-heavy stores, review delivered and realised orders after returns have had time to occur.
A strong ad that leads to a confusing product page can underperform. Use the Shopify product-page optimisation guide to check the message, product evidence, variant selection and purchase path before concluding that another creative is the only fix.
Which metrics matter for lead-generation creative analysis?
Begin with a clearly scoped lead count and CPL, then connect the records to lead validity, qualification, appointment attendance and customers. Define qualification before reviewing variants so one salesperson’s judgement does not become another creative’s apparent advantage.
- Valid lead: a usable, relevant enquiry rather than spam, a duplicate or an incomplete/test record.
- Qualified lead: a lead meeting documented fit criteria such as service need, supported geography and feasible timing.
- Contact rate: contacted leads divided by the cohort that had an opportunity to be contacted; define what “contacted” means.
- Qualified CPL: assigned ad spend divided by qualified leads in the same acquisition cohort.
- Show rate: attended appointments divided by appointments due by the cutoff, rather than including future appointments.
- Ad-only customer acquisition cost: assigned ad spend divided by verified new customers. Add sales/other acquisition costs separately if reporting a fully loaded CAC.
In the CRM, retain ad ID or another reliable source mapping, acquisition date, stage timestamps and disqualification reasons. Keep unmapped and unreviewed records as unknown. A CRM connection does not guarantee that every quality field will be available as a native Meta column.
Read lead quality alongside speed of follow-up. If relevant enquiries sit unanswered, the creative is not the only variable. Our guide to Meta Ads lead quality covers that broader enquiry-to-sales process.
Which custom metrics should you create?
Use the following as a formula dictionary. Where the account’s custom-metric builder exposes the required fields, calculate there; otherwise export and calculate in a controlled spreadsheet or BI report. Keep the formula name specific enough that another person can reproduce it.
| Metric | Formula | Important limitation |
|---|---|---|
| Hook 3s | 3-second plays ÷ impressions | Video attention proxy; compare like formats and placements. |
| Hold 15s | 15-second ThruPlays ÷ 3-second plays | Use the exact 15s field and comparable videos at least 15s long. |
| Outbound CTR | Outbound clicks ÷ impressions | Website intent, not proof of arrival. |
| Cost per outbound click | Spend ÷ outbound clicks | Different from CPC based on all clicks or link clicks. |
| LPV/outbound-click ratio | Landing page views ÷ outbound clicks | Diagnostic proxy; measurement and event counting can differ. |
| Purchase/LPV ratio | Attributed website purchases ÷ LPV | Not a matched-session conversion rate; attribution can include other interactions. |
| Attributed order value | Website purchase value ÷ website purchases | Not necessarily net store AOV after returns. |
| Form completion proxy | Scoped native form leads ÷ native form opens | Only when compatible fields exist; not a website-lead formula. |
| Qualification rate | Qualified leads ÷ valid leads | Same cohort, fixed rules and enough time to assess; usually CRM. |
| Qualified CPL | Assigned spend ÷ qualified leads | Unknown outcomes cannot be set to zero. |
| New-customer CAC | Assigned acquisition spend ÷ verified new customers | Requires reliable customer/source data and stated cost scope. |
| Contribution after ads | Net revenue − variable costs − assigned ad spend | Finance/store measure; avoid subtracting a cost twice. |
Formatting check: if the builder formats a ratio as a percentage, 3,000 ÷ 10,000 should display 30%. Do not also multiply by 100 and accidentally show 3,000%. If the tool expects a raw numerical percentage, configure accordingly and verify a known row.
Zero and aggregation checks: show N/A for a missing or zero denominator; keep an observed zero numerator valid when the denominator is positive. Calculate total CTR from total clicks ÷ total impressions, not the average of row CTRs. Calculate total CPA from total spend ÷ total conversions. Reach is a deduplicated, scope-dependent measure: adding each ad’s reach does not produce unique campaign reach.
A custom metric is a calculation. It is different from a custom conversion, event or performance goal. Creating a dashboard formula does not automatically tell Meta to optimise delivery for that formula.
How do you build a Meta Ads creative dashboard step by step?
1. Open the correct account and select Ads
Start at ad level so each execution can be reviewed. Include ad name, ad ID and delivery status. Use stable concept/variant IDs in your working record; names can be edited and the same creative may run through several ads.
2. Set complete dates and comparable filters
A last-complete-seven-days versus previous-complete-seven-days view can be an initial review cadence. It is not a rule for statistical confidence. Extend the window for low volume or a longer buying cycle, and record lag. Filter consistently by objective, conversion location and audience/test group. Do not exclude a paused ad that spent money during the period merely because it is inactive now.
3. Choose Columns → Customise columns
Select the required fields, put the key business outcomes near the front, remove distracting columns, then save the selection as a named preset and apply it. This is the path documented in Meta’s columns guide.
4. Save these three reporting presets
| Preset | Suggested left-to-right columns |
|---|---|
| DA | Creative diagnostics | Ad name, ad ID, delivery, spend, impressions, reach, frequency, CPM, 3s plays, Hook 3s, 15s ThruPlays, Hold 15s, average play time, outbound clicks, outbound CTR, LPV. |
| DA | Ecommerce outcomes | Ad name, ad ID, spend, website purchases, website purchase CPA, website purchase value, website purchase ROAS, attributed order value, LPV, add-to-cart, checkout, purchase/LPV proxy, frequency. |
| DA | Lead outcomes | Ad name, ad ID, spend, explicitly scoped leads, CPL, native form opens or website LPV as applicable, completion proxy, relevant conversation count, frequency. |
Do not put incompatible website, instant-form and messaging denominators into one blended conversion rate. Save separate filtered versions when more than one lead route is used.
5. Add custom metrics where the interface supports them
Look for the custom-metric option in the reporting surface available to your account. Give each metric a clear name, description, formula and display format. Use selectable field tokens rather than assuming a typed label is recognised. Validate the preview against a manual calculation.
If the option or a required raw field is unavailable, export the existing fields and calculate outside Meta. A missing CRM qualification field cannot be recovered by changing the formula. Document the gap instead of presenting invented qualified-lead numbers.
6. Inspect creative and placement breakdowns carefully
Start with one dimension, such as placement, to avoid creating tiny slices. Preview the actual crop, text and CTA. Account-dependent Ad creative breakdowns can group creative performance, but Meta lists limitations, including dynamic-creative exclusions in that view.
The separate View ad creative performance report documents asset/language comparisons through Reports and a selected dynamic-creative asset dimension where applicable. These are different reporting views. Do not promise that every automated variation, asset combination or conversion metric will be available for every campaign.
7. Add an external CRM or store quality view
Export ad IDs and the stated reporting scope. Join to reliably mapped CRM or store records, retaining unmapped rows. Include cohort age, valid/qualified leads or realised orders, response time, new customers, contribution and the relevant quality guardrail. Avoid duplicating ad spend across repeated CRM rows; aggregate at a consistent grain before joining.
8. Save a decision board and validate it
For each creative, show its preview, concept, spend, outcome count, primary KPI versus target, quality concern, confidence, next action, owner and review date. A useful chart plots spend against purchase CPA or qualified CPL, with outcome volume visible. Label low-volume points “insufficient evidence”. Do not hide weak business results behind a blended creative score.
Spot-check one known ad against the source report, check the date/timezone and attribution setting, and recalculate several ratios. Keep the native dashboard for delivery diagnostics and the external quality board for outcomes that cannot be reliably reported there.
How do you turn creative analysis into a useful test?
Tag each execution by concept, hook, format, duration, offer, product/service, CTA, language, destination version and launch date. For example, a product demonstration is a concept; changing its opening sentence creates a variant. Record automatic enhancements or additional text options so the test record reflects what may actually be delivered.
Write a hypothesis that connects the change to a business outcome: “Showing product dimensions early will reduce unsuitable clicks and improve purchase CPA.” Hold the offer, destination and relevant campaign conditions steady. If a concept test intentionally changes several elements, interpret the overall concept rather than claiming one word caused the effect.
Meta’s A/B testing documentation describes separated audience groups. Use an appropriate controlled test when the question requires causal evidence. Two ads in one ad set can receive unequal, non-random delivery; the highest-spend ad is not automatically a proven creative winner.
Before launch, define the main KPI, commercially meaningful improvement, outcome-maturity period, maximum acceptable test loss and intended analysis date. No universal ₹500 spend, 1,000 impressions, three-day period or fixed conversion count proves a result for every business. A risk limit can justify stopping before certainty, but label that decision accurately.
When should you keep, iterate, pause or investigate?
| Observed pattern | First investigation | Possible next action |
|---|---|---|
| Weak hook and poor mature outcomes | Comparable duration/placement, audience and message relevance | Test a clearer opening or product demonstration. |
| Strong hook, weak 15s hold | Pacing and proof after the opening | Move useful evidence earlier; remove an irrelevant hook. |
| Good attention, weak buying intent | Offer, CTA, objective and promise | Test a message that attracts the intended buyer. |
| Clicks, few landing page views | Mobile destination, redirects and measurement coverage | Fix the path before treating the ratio as a speed diagnosis. |
| Many carts, few realised orders | Delivery charges, payment, stock, COD and returns | Investigate checkout and fulfilment. |
| Low CPL, poor qualification | Ad promise, form and qualification consistency | Test clearer fit conditions and measure qualified CPL. |
| Good lead fit, poor attendance | Response time, scheduling and reminder ownership | Improve follow-up and remeasure the same cohort. |
| Frequency rises while CTR and CPA worsen | Audience/placement mix, auction, offer and website changes | Investigate fatigue and test another relevant angle. |
| Little delivery or one conversion | Eligibility, budget allocation and observation period | Mark insufficient evidence; consider a designed retest. |
Keep a creative when mature outcomes meet the business target and quality checks hold. Iterate when you have a specific weakness to test. Pause immediately for broken journeys or misleading information, or at the agreed risk limit. Increase spend with a fresh review plan: a different budget can change delivery and marginal acquisition cost.
What do the numbers look like in practice?
Hypothetical ecommerce comparison
Assume the same reporting scope and mature observation window. These synthetic results illustrate interpretation, not statistical proof.
| Metric | A: attention-led ad | B: product demo |
|---|---|---|
| Spend | ₹10,000 | ₹10,000 |
| Outbound clicks | 800 | 500 |
| Landing page views | 640 | 450 |
| Website purchases | 10 | 20 |
| Attributed purchase value | ₹20,000 | ₹40,000 |
| Purchase CPA | ₹1,000 | ₹500 |
| ROAS | 2× | 4× |
| Purchase/LPV proxy | 1.56% | 4.44% |
A buys cheaper outbound clicks: ₹12.50 versus ₹20. B records more purchases at a lower CPA. Against the earlier illustrative ₹600 allowance, B deserves further consideration. Validate customer mix, realised margin and attribution before scaling; the table alone does not prove that the demo caused the difference.
Hypothetical lead-generation comparison
Assume equal follow-up opportunity, fixed qualification rules and the same acquisition-cohort cutoff. All leads in this example are valid and have been assessed.
| Metric | A: broad promise | B: qualifying message |
|---|---|---|
| Spend | ₹10,000 | ₹10,000 |
| Valid leads | 100 | 50 |
| CPL | ₹100 | ₹200 |
| Qualified leads | 10 | 20 |
| Qualification rate | 10% | 40% |
| Qualified CPL | ₹1,000 | ₹500 |
| New customers | 1 | 4 |
| Ad-only CAC | ₹10,000 | ₹2,500 |
B’s raw lead cost is twice as high, yet its qualified-lead cost is half as high. The customer counts are still small. Review the actual qualification and sales records and gather more evidence before declaring a reliable closing advantage.
What belongs in a complete Meta Ads creative testing checklist?
Before launch
- Primary business KPI, quality guardrail, owner and acceptable cost defined.
- Purchase/lead completion, currency, value, duplication and test events checked.
- Ad ID, concept, hook, format, length, offer and destination version recorded.
- Source/CRM mapping, timezone, attribution and reporting cutoff documented.
- Prospecting, retargeting and conversion locations separated.
- Mobile page, form, checkout, product availability and payment path checked.
- Crop, captions, audio, safe areas and CTA previewed.
- Hypothesis, comparison design, risk budget and decision date agreed.
During delivery
- Spend, billing, disapprovals and destination errors monitored.
- New enquiries routed to the right owner; response delays flagged.
- Same-day outcomes labelled provisional.
- Customer comments reviewed for product questions and mismatched expectations.
- Test variables kept stable unless a material problem requires intervention.
- No winner declared from CTR, highest spend or one purchase alone.
At the creative review
- Equal complete periods and comparable objective/audience/placement scopes used.
- Spend, impressions and outcome counts shown beside rates.
- Static and video rows separated; video duration and exact ThruPlay field checked.
- All-click, link and outbound metrics distinguished.
- LPV/event ratios labelled as proxies where they are not matched cohorts.
- Ratios recomputed from totals; unique reach not summed across ads.
- Ecommerce margin, customer mix and mature returns reviewed.
- Lead validity, qualification, follow-up, shows and customers reviewed.
- Fatigue checked against auction, offer, website and tracking changes.
- Missing or low-volume evidence clearly labelled.
- Keep, iterate, test, pause or investigate decision recorded with a reason.
- Next hypothesis, owner and remeasurement date assigned before handoff.
Copy-ready review record: date/analyst; account/timezone; ad ID/concept; date range/attribution; cohort maturity; spend/impressions/outcomes; KPI versus target; quality evidence; competing explanation; decision; next change; owner; next review date.
Frequently asked questions
What is a good hook rate or CTR for Meta Ads?
There is no universal pass mark. Compare the same metric definition across similar objectives, formats, lengths, audiences and placements. A strong attention ratio is useful only when the creative also attracts commercially relevant outcomes.
Should I stop an ad when frequency reaches three or five?
Not automatically. Frequency depends on the selected period and audience. Rising frequency combined with worsening intent and mature outcomes supports a fatigue investigation, but auction, offer and website changes can create a similar pattern.
Can qualified CPL be reported inside Meta?
Only when the relevant downstream event is integrated, attributable and available in the reporting surface. Otherwise calculate it from reliable CRM cohorts and assigned spend outside Meta. Do not interpret an unavailable field as zero qualified leads.
Why do Meta, Shopify and GA4 show different results?
They can use different attribution rules, event definitions, reporting times, identifiers, consent coverage and refund treatment. Reconcile those definitions before judging the creative. Do not force a match by replacing one system’s figures with another’s without explaining the basis.
How long should I run a creative test?
Long enough for the planned outcome window and useful evidence, subject to the agreed risk budget. A three-day rule cannot accommodate every purchase cycle or low-volume service business. Preserve “insufficient evidence” when the sample cannot support the intended conclusion.
Is the ad with the highest spend the best creative?
It shows where the delivery system allocated more budget under those conditions. Validate the business KPI and quality before calling it a winner. Unequal delivery in an ad set is not the same as a controlled comparison.
How do I analyse static images without video metrics?
Review relevant click or native-form actions, destination behaviour and business outcomes. Inspect whether the image, headline and offer make the next step clear. A three-second video hook metric has no meaningful value for a static image.
Will a custom dashboard change campaign optimisation?
No. It organises evidence for decisions. Actual delivery follows the selected objective, performance goal and available event signals. A custom ratio must not be confused with a configured conversion event or an optimisation goal.
Connect the creative decision to the rest of the funnel
If your creative reports show clicks or cheap leads but do not explain sales quality, Digi Amenity can review your Meta Ads creative, reporting and conversion journey together, including the landing page and follow-up, before you scale the next variation.