

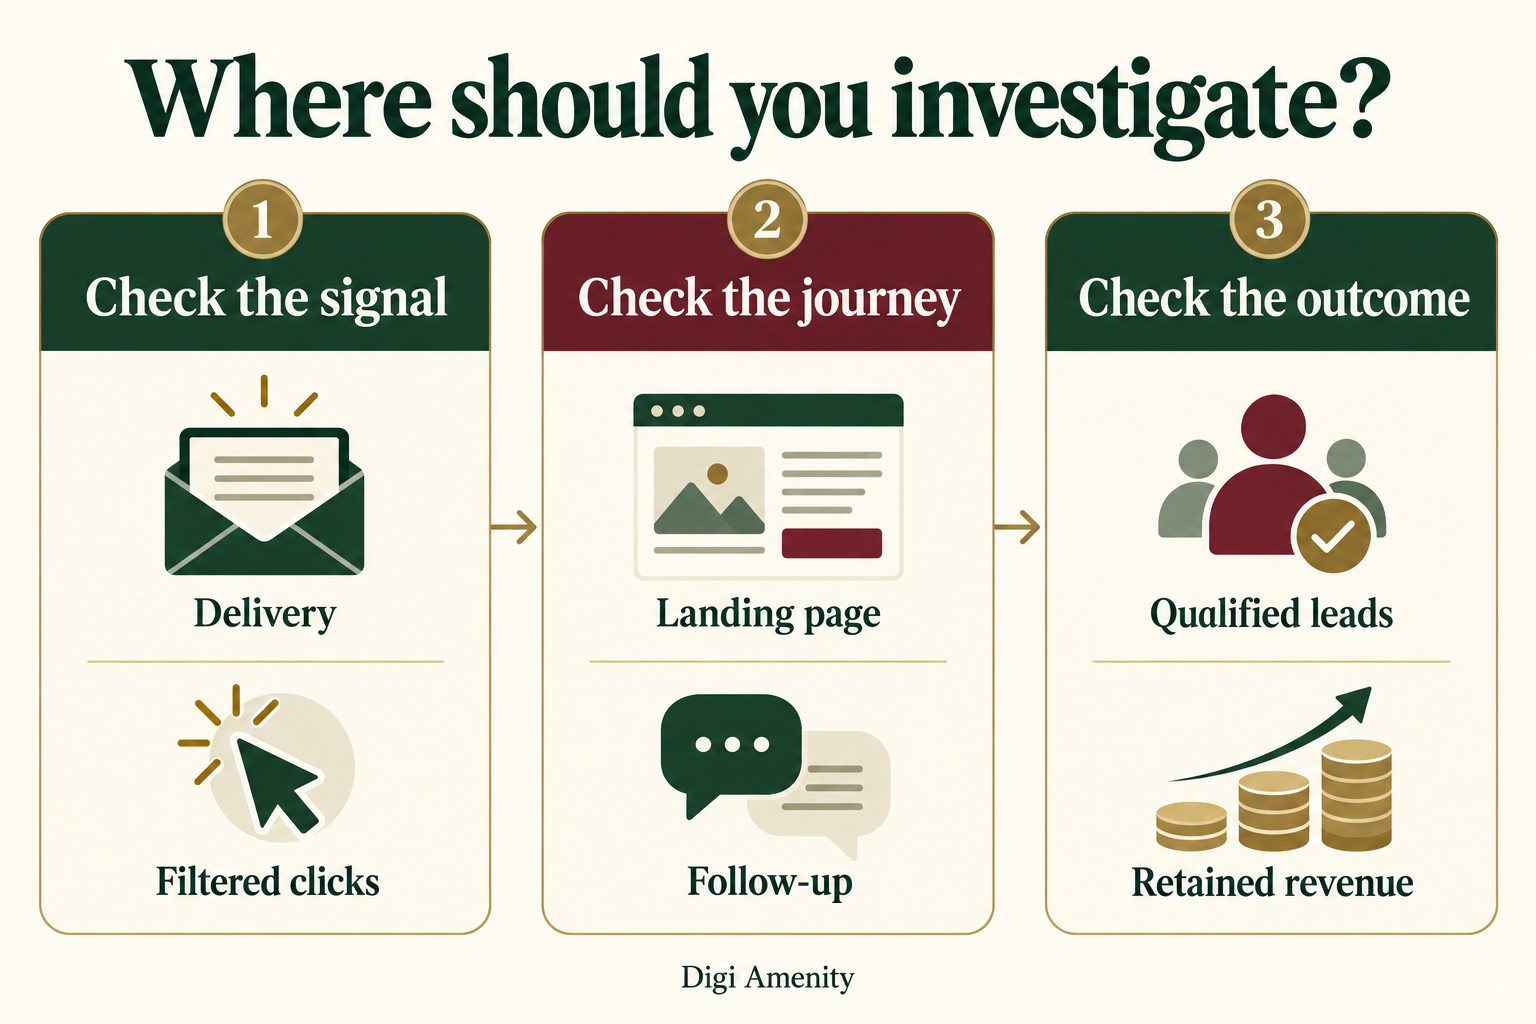
The most useful email marketing metrics connect delivery and genuine engagement to a verified business outcome. Start with delivered messages, filtered unique clickers, qualified enquiries or retained orders, and the cost of producing those outcomes. Define the denominator and reporting window before comparing campaigns. Open rates can support diagnosis, but they should not decide your budget on their own.
For an Indian service business, the important question may be whether email creates enquiries that sales can actually serve. For an online store, it may be whether orders still contribute margin after discounts, cancellations and returns. The same email report cannot answer both questions without different outcome definitions.
This guide explains which numbers to use, how to calculate them and how to decide what to fix. Numerical examples are hypothetical, not Digi Amenity client results.
Which email marketing metrics should your dashboard include?
Begin with a small dashboard that supports a decision. Keep delivery and unsubscribe signals as guardrails, clicks as a diagnostic, and a verified business outcome as the main success measure. Add metrics only when someone can explain what action a change would trigger.
| Business task | Main outcome | Supporting evidence |
|---|---|---|
| Generate service enquiries | Qualified leads and cost per qualified lead | Filtered clickers, valid form submissions, qualification reasons and response time |
| Sell products | Retained revenue and contribution after campaign costs | Orders, refunds, product margin, delivery costs and campaign attribution rule |
| Educate existing subscribers | A defined useful action, such as a resource visit or relevant reply | Content-link clicks, replies reviewed by a person, unsubscribes and subsequent outcomes |
A download is not automatically a qualified lead. A WhatsApp button click is not a completed conversation. A purchase event is not automatically a paid, retained order. Keep these stages separate so a tracking improvement cannot be mistaken for a business improvement.
What should you agree before calculating the numbers?
Create a short measurement contract for every report. This is a written agreement about what each number includes, not a complicated technical project.
- Population: which campaign, segment and message type are included? Separate promotional broadcasts from transactional messages and automated welcome journeys.
- Counting unit: are you counting messages, unique recipients, click events, sessions, leads or orders?
- Window: specify the send period, outcome follow-up period, timezone and date the data was extracted.
- Filtering: record bot filtering, internal/test exclusions and duplicate-removal rules.
- Outcome: define a qualified lead or retained order and identify the person or system confirming it.
- Attribution: state how the outcome receives campaign credit. Do not merge different platforms’ credited revenue.
- Money: use one currency and a consistent treatment of tax, discounts, refunds and costs.
For example, a team might compare campaigns seven days after each send and revisit revenue after its normal return window. Those are business choices, not universal standards. A B2B sales cycle may need much longer. Compare equally mature campaigns rather than yesterday’s send with a campaign that has collected orders for a month.
How do you calculate the core email marketing KPIs?
The definitions below form a usable reporting convention. Your email provider may label or calculate a field differently, so check its export definitions before combining data. Percentages multiply the stated ratio by 100.
| Metric | Calculation for this guide | What to watch |
|---|---|---|
| Delivery rate | Messages accepted by receiving servers ÷ attempted sends × 100 | Acceptance does not prove inbox placement. Pending or deferred messages can change the final result. |
| Bounce rate | Final bounced messages ÷ attempted sends × 100 | Inspect permanent and temporary failures separately; do not combine different reporting cutoffs. |
| Email click-through rate | Filtered unique recipients clicking a content link ÷ delivered messages × 100 | Exclude unsubscribe and preference links from this editorial engagement definition. Remaining clicks are not guaranteed human. |
| Delivered-recipient conversion rate | Unique converting recipients credited under the agreed rule ÷ delivered messages × 100 | Define the conversion. This is different from conversions divided by clicks or sessions. |
| Lead qualification rate | Qualified leads ÷ valid, deduplicated enquiries × 100 | Apply the same qualification criteria and allow enough time for sales review. |
| Cost per qualified lead | Allocated campaign cost ÷ qualified leads | If there are no qualified leads, report “no qualified leads yet”; do not display a zero cost. |
| Retained revenue per delivered message | Campaign-attributed revenue after agreed refund/cancellation adjustments ÷ delivered messages | Revenue is not profit; specify tax and shipping treatment. |
| Unsubscribe rate | Unique unsubscribing recipients ÷ delivered messages × 100 | Use the provider’s documented reporting window. A change needs segment and frequency context. |
If a denominator is zero or unavailable, show “not applicable” or “unavailable”, with a reason. Do not replace missing data with zero.
For a monthly delivery-weighted CTR, divide the sum of campaign-level filtered unique clickers by the sum of delivered messages. A person can appear once in several campaigns: this measures recipient-message engagement, not unique people across the month. If you want monthly audience reach, deduplicate people separately. Avoid a simple average of campaign percentages because it gives a small send the same weight as a large one.
Why can open rates and click rates mislead you?
Apple Mail Privacy Protection can preload tracking pixels without a person reading the message. It affects users who use the relevant Apple Mail protection, not every person with an iPhone. Open rate and click-to-open rate therefore cannot be treated as clean measures of attention. Open-based automation and subject-line tests also need caution. Mailchimp explains these measurement effects.
Clicks are not immune to distortion. Security scanners and link-preview systems can visit links automatically. Mailchimp’s bot-activity guidance describes filtering for suspected non-human opens and clicks; filtering reduces noise but does not certify every remaining action as human. Record whether filtering is enabled and when it changed before comparing historical reports.
Use opens as a qualified diagnostic alongside delivery and downstream activity. If reported clicks rise sharply while website engagement, enquiries and orders remain flat, investigate tracking and filtering before celebrating a creative winner. A discrepancy is a clue, not proof of bots: consent choices, page-load failures and different counting rules can also contribute.
How do you build a report that connects email to business results?
1. Export the send cohort and preserve its definitions
Keep campaign ID, send time, segment, attempted sends, delivered messages, filtered unique clickers, unsubscribes and the provider’s complaint metric. Store the original export alongside the reporting worksheet. Label a missing field rather than inventing it.
Do not assume a provider’s complaint percentage and Gmail’s Postmaster Tools spam rate use identical populations. Review sender-specific diagnostics in their own context. Google’s Gmail sender guidelines also set authentication and unsubscribe requirements according to sending scope. If delivery is the problem, use the email deliverability checklist before increasing volume.
2. Use consistent campaign links
Tag external email links with a stable source, utm_medium=email and campaign name. Use utm_content to distinguish meaningful link placements. Google’s campaign URL guide explains how these values appear in traffic acquisition reporting and notes that parameter values are case-sensitive.
A hypothetical link could use utm_source=customer_newsletter&utm_medium=email&utm_campaign=october_service_review&utm_content=main_cta. Keep names consistent, verify the destination and avoid personal information in URLs. Our UTM tracking guide covers a practical naming process.
3. Check the landing-page journey
Compare email engagement with the tagged traffic reaching the intended page. Test the mobile landing page, primary link, form validation and confirmation journey. Use a controlled test record, clearly excluded from business totals; do not submit fictitious customer enquiries into a live sales workflow.
An email platform counts its tracked interactions; web analytics counts activity it can observe under its own rules. Expect differences. Investigate broken links, consent handling, redirects and duplicate events instead of forcing the two totals to match.
4. Reconcile leads or orders with the operational system
For services, join the campaign reference to valid enquiries and then to the sales team’s qualification decision. Keep reasons such as outside service area, duplicate, unsuitable requirement or qualified opportunity. Review first-response time as a separate process measure.
For stores, reconcile credited orders against the order system using stable order IDs. Remove test and duplicate records; track cancellations, refunds and payment status. If orders are credited by multiple marketing systems, do not add those revenue totals together.
5. Review one decision, owner and date
A useful report ends with a proposed action: fix a mobile form, clarify an offer, revise a segment, improve follow-up or investigate a data discrepancy. Assign an owner and a remeasurement date. Change one major variable when practical, and allow outcomes to mature before declaring a winner.
What does a lead-generation example look like?
Hypothetical example: a Mumbai B2B service firm sends one campaign to 2,000 subscribed contacts. At the agreed cutoff, 1,960 messages are delivered and 40 have bounced. There are 78 filtered unique content-link clickers, 12 valid enquiries and four leads that meet the firm’s documented service-fit criteria. Allocated campaign cost is ₹6,000.
- Delivery rate: 1,960 ÷ 2,000 = 98%.
- Email click-through rate: 78 ÷ 1,960 = 3.98%.
- Lead qualification rate: 4 ÷ 12 = 33.3%.
- Cost per qualified lead: ₹6,000 ÷ 4 = ₹1,500.
These are illustrative calculations, not recommended benchmarks. Whether ₹1,500 is acceptable depends on close rate, contribution per customer, sales capacity and acquisition alternatives. With only four qualified leads, a small change in count will move the result substantially.
Before rewriting the subject line, inspect the eight enquiries that did not qualify. If they misunderstood the service, improve the promise and landing-page explanation. If qualified prospects were contacted too late, the next action belongs to follow-up. Email creative is only one part of the system.
How should an online store calculate email marketing ROI?
Separate revenue efficiency from profit. “Revenue divided by email spend” is a revenue multiple. It is not the same as return after product, fulfilment and campaign costs.
A useful management calculation is: (attributed contribution before email costs − allocated email costs) ÷ allocated email costs × 100. Agree which variable costs the contribution figure includes and avoid deducting the same cost twice. Label this as an attribution-based estimate, not evidence of incremental profit caused by email.
Hypothetical example: a store campaign has 5,000 delivered messages and ₹60,000 in credited sales after discounts, excluding tax and shipping receipts. Subsequent cancellations and refunds reduce retained revenue to ₹48,000. Finance confirms ₹28,800 in associated product and variable fulfilment/payment costs after relevant adjustments. Email production, platform allocation and operational costs total ₹12,000.
- Retained revenue per delivered message: ₹48,000 ÷ 5,000 = ₹9.60.
- Contribution before email costs: ₹48,000 − ₹28,800 = ₹19,200.
- Contribution after email costs: ₹19,200 − ₹12,000 = ₹7,200.
- Attribution-based campaign return: ₹7,200 ÷ ₹12,000 = 60%.
The revenue multiple is 4×, while the defined contribution-based return is 60%. They answer different questions. Neither proves that every credited order would have disappeared without the campaign. Where audience size and operations permit, a properly designed randomised holdout can help estimate incremental impact; small or contaminated groups can produce inconclusive evidence.
What should you do when a metric changes?
| Observed pattern | Investigate first | Practical next action |
|---|---|---|
| Delivery falls | Bounce reasons, authentication, list source and sending changes | Resolve the identified issue before increasing frequency or volume. |
| Clicks rise; website activity does not | Filtering, destination links, redirects and measurement scope | Trace a controlled click and document the discrepancy. |
| Visits rise; valid enquiries do not | Mobile form, message-to-page match, offer and trust information | Repair one verified friction point and remeasure. |
| Enquiries rise; qualification falls | Audience fit, misleading promises and follow-up records | Review rejection reasons before narrowing targeting. |
| Credited revenue rises; contribution falls | Discount depth, product mix, returns and allocated costs | Compare retained margin by campaign and segment. |
| Unsubscribes increase | Frequency, expectations at signup and segment relevance | Inspect the affected cohort; respect opt-outs and adjust the programme. |
What belongs on the reporting checklist?
- Name the business decision and one main outcome.
- Record campaign IDs, segments, timezone, extraction date and outcome window.
- Show numerator, denominator, raw counts and filtering rules beside each rate.
- Separate broadcasts, automated journeys and transactional messages.
- Validate campaign links and the mobile conversion journey.
- Reconcile valid leads or retained orders; exclude test and duplicate records.
- Keep attributed revenue, contribution and incremental impact distinct.
- Compare equally mature cohorts with consistent definitions.
- Record one action, its owner, expected signal and review date.
Frequently asked questions about email marketing metrics
What is the most important email marketing metric?
Choose the verified outcome closest to the campaign’s purpose. A service business may prioritise qualified leads and acquisition cost; a store may prioritise retained contribution. Delivery, complaints and unsubscribes remain guardrails, even when sales are strong.
What is a good email click-through rate in India?
There is no single rate in this guide that applies across Indian industries, lists and campaign types. Start with your own comparable, bot-filtered cohorts. Check whether a benchmark uses unique clickers or total clicks, delivered messages or sends, and a relevant audience before using it.
Should we stop reporting open rate?
You can retain it with an explicit privacy limitation and stable filtering settings. Avoid making it the sole success measure or excluding subscribers only because they appear not to open messages. Combine it with consent records, clicks, replies and business outcomes.
How is email conversion rate different from website conversion rate?
An email conversion rate might divide unique converting recipients by delivered messages. A website report may divide converting sessions by sessions. Both can be useful, but they describe different populations. Write the denominator into the label instead of presenting two incomparable percentages as a discrepancy.
Why do our email platform and GA4 show different results?
They observe different events and may apply different filters, identity rules, consent handling, timezones and attribution windows. Start by aligning the campaign, dates and counting unit. Then reconcile the journey and business records; do not assume either dashboard is a complete record of human behaviour.
How often should we review email performance?
Check operational problems soon after sending, then evaluate outcomes after a predefined maturity window. Use a monthly review for segment trends and economics. Longer sales cycles need later follow-up; an early report should clearly label leads or revenue still awaiting confirmation.
Can a small list run meaningful tests?
A small list can reveal broken links, confusing offers and poor follow-up, but it may not provide enough outcomes to identify a reliable statistical winner. Show raw counts, keep comparisons consistent and avoid stopping a test as soon as one version looks ahead. Treat inconclusive results as inconclusive.
Need help connecting campaign reports to actual outcomes?
If email reports show engagement but qualified enquiries or profitable orders remain unclear, Digi Amenity can review the email, landing-page, tracking and follow-up journey before you increase sending volume. Explore our email marketing services to discuss the reporting gaps that matter to your business.