

Google Search Console multimodal reporting helps you see how your website appears when people search using an image, including Google Lens and Circle to Search. Start by checking the Multimodal search type, identifying the pages receiving exposure, and comparing consistent reporting periods. Treat visibility, website visits and business outcomes as separate measurements.
For an Indian ecommerce business, the useful question is whether visual discovery leads people towards relevant products and a workable purchase journey. A new reporting filter does not establish that your images need replacing, that customers are buying, or that your SEO strategy has suddenly stopped working.
Platform information checked on 14 October 2026. This guide separates documented reporting features from Digi Amenity’s suggested analysis workflow.
What changed in Google Search Console multimodal reporting?
Google announced the reporting change on 24 September 2026, with a global rollout. Its announcement covers searches involving images through Lens, Circle to Search on Android, uploaded images and Chrome’s image-search action. The Multimodal filter is available in Search Console’s Search results and Generative AI performance reports. See Google’s announcement.
This is a measurement update. It provides a way to investigate a discovery channel; it does not announce a ranking bonus for adding images. Global rollout also does not mean every property will have meaningful data. Check the options and dates actually available in your property before promising a report to a client or stakeholder.
How is multimodal search different from Google Images and AI search?
The distinction is between the input someone uses and the result experience they see. Searching with an image is different from typing a phrase and opening an image-results tab. An AI-generated answer is another dimension again.
| Reporting view | What it helps examine | What to avoid assuming |
|---|---|---|
| Web text search | Discovery through text-based web searches | That its audience and intent match visual discovery |
| Multimodal search | Web discovery where an image forms part of the search input | That the report identifies the exact customer photograph |
| Image search | Performance in Google’s image-search results | That all visual-search activity belongs in this view |
| Generative AI report | Reported appearances in AI Overviews and AI Mode | That its impressions are additional to all Web impressions |
Google’s Search results documentation and Generative AI report documentation explain these boundaries. The latter currently reports impressions, and its data is included within Web reporting. Adding those totals together would double count exposure.
How do you set up the first useful report?
- Select the correct Search Console property. Confirm that it covers the canonical URLs you want to assess. A report from the wrong URL-prefix property can produce an incomplete picture.
- Open Performance → Search results. Open the Search type control, choose Multimodal and apply it. Interface labels can vary as Google updates the product.
- Choose complete dates with available data. Start with a seven-day window if that is all the new reporting supports for your property. Use a longer window when traffic is sparse. Record the extraction date.
- Set geography deliberately. Use India for an India-specific business question. Keep a separate all-country view when exports or international customers matter.
- Review Pages before interpreting demand. Identify the canonical URLs receiving impressions and clicks. Group them into products, categories, guides or service pages.
- Check device patterns. Compare within a stable device segment before attributing a change to content. A changing device mix can change the result.
- Export the view and save its filter definition. Keep the original file, a dated working copy and notes about missing fields. Another team member should be able to reconstruct the same comparison.
The operational benefit of these steps is reproducibility. “Visual search increased” is hard to investigate. “These product pages received more reported impressions in India on mobile across two complete seven-day periods” is a claim a team can check.
Do not assume that selecting an older date produces a complete historical baseline. Establish the earliest usable date in the property and label any comparison affected by reporting availability. Avoid comparing an incomplete current day with a complete previous day.
Which metrics should a business owner actually use?
Use impressions to understand exposure and clicks to understand reported movement from Search. Calculate CTR as clicks divided by impressions, multiplied by 100. When impressions are zero, leave CTR undefined rather than presenting a meaningful zero-percent rate. Average position is contextual search reporting, not a fixed ranking for every customer.
Google’s performance-dimension documentation states that the Queries dimension is unavailable for multimodal searches. Do not invent a keyword list from page titles or treat a text-search query export as the missing multimodal query report.
For practical visual search analytics, use three levels of questions:
- Discovery: Which relevant pages receive exposure, and is it concentrated in products that the business can actually sell?
- Journey: Does the destination explain the item, show the right variant and work on a phone?
- Outcome: Are purchases or qualified enquiries being recorded accurately on those landing pages?
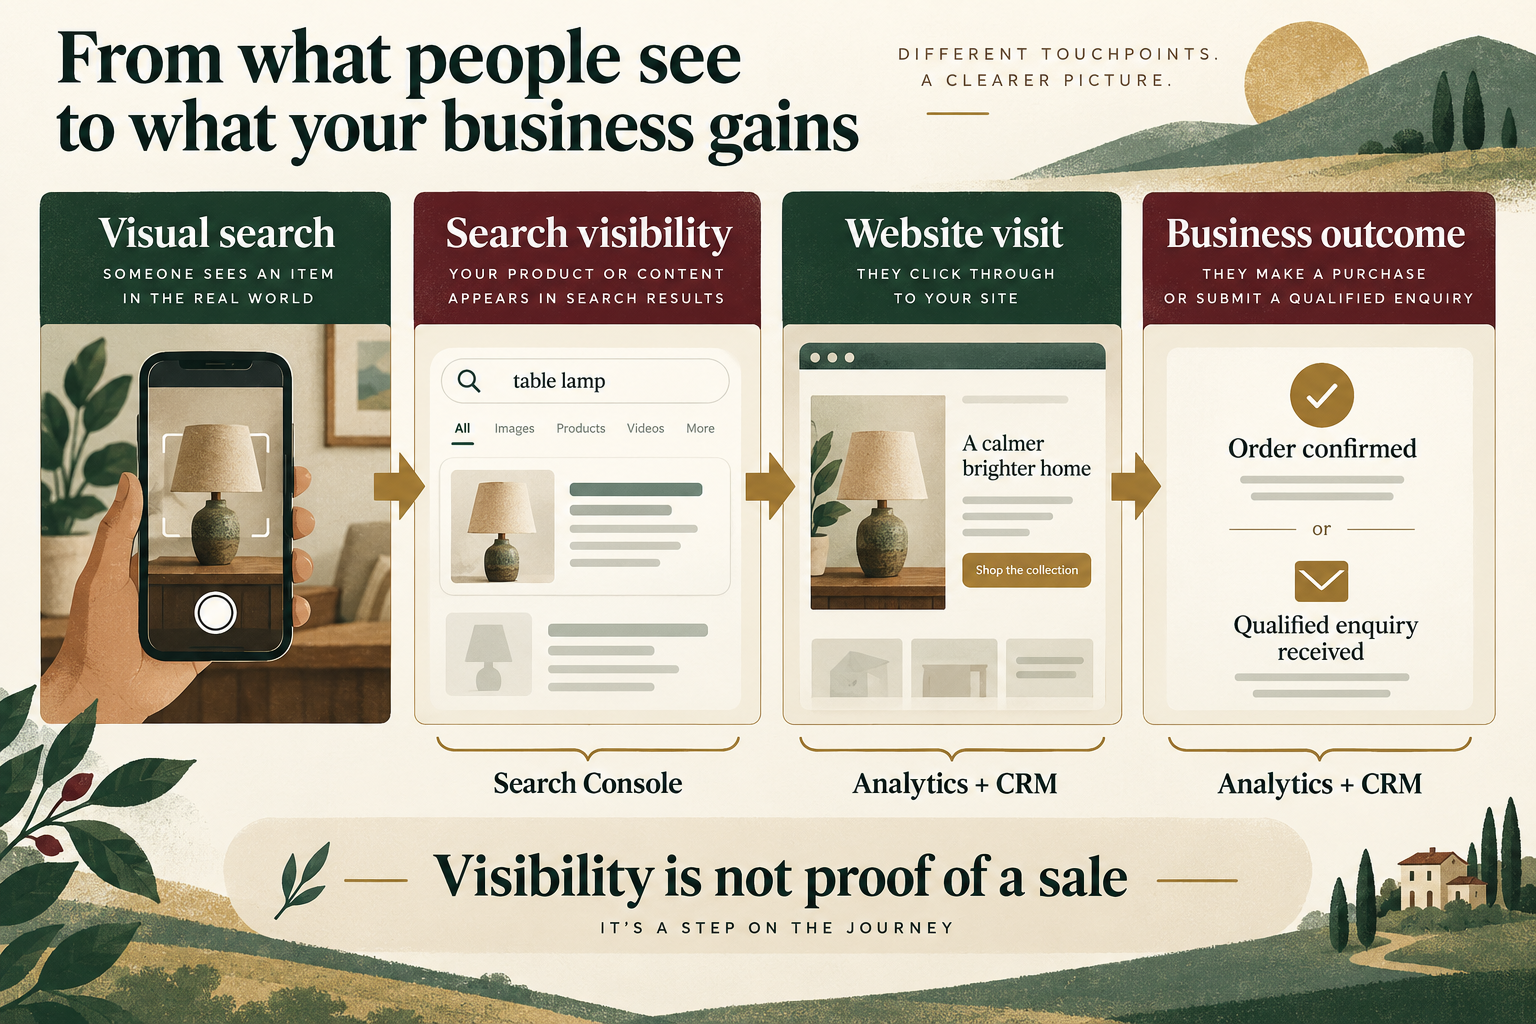
Can you connect multimodal search performance to revenue?
You can compare Search Console page trends with the corresponding landing-page results in analytics and your order or lead records. That is useful context, but it does not automatically identify which individual purchase began with Lens or another image-assisted search.
Keep a clear distinction between a page-level association and an attributed conversion. For example, a product page might gain multimodal impressions while purchases increase because of a promotion, email campaign or improved stock availability. The two trends alone do not establish causation.
Google Analytics uses traffic-source dimensions and attribution mechanisms that differ from Search Console’s search reporting. Consult Google’s traffic-source guidance before building a combined dashboard. Do not label all Google organic revenue “Lens revenue.”
For ecommerce, verify that a purchase event corresponds to a real order and is not duplicated. For lead generation, define a qualified enquiry with the sales team: relevant service, serviceable location, valid contact details and genuine intent. A WhatsApp button click or form start can be a useful intermediate action, but it is not automatically a qualified lead.
This is where Digi Amenity’s approach connects SEO, tracking and the website. An image can attract interest while unclear pricing, a slow product page, unavailable delivery or poor follow-up prevents a useful outcome. Reporting should make those handoffs visible.
What should you do when the numbers look weak?
Choose an action based on the evidence available, rather than treating every low metric as an image problem.
| Observation | Check next | Reasonable decision |
|---|---|---|
| No reported exposure | Dates, filters, indexing, image accessibility and relevance of the page to visual discovery | Investigate; do not diagnose a penalty or technical fault from the metric alone |
| Impressions but few clicks | Sample size, page mix, device mix and whether the destination addresses likely intent | Review the offer and content context before replacing every photograph |
| Clicks increase but business outcomes do not | Tracking accuracy, stock, mobile UX, delivery information, forms and follow-up | Audit the landing journey and measurement |
| A small group of relevant pages gains sustained exposure | Whether the pattern persists across complete comparable periods | Consider a limited content or photography test with a defined review date |
These are suggested decision rules, not Google thresholds. There is no universal minimum CTR or impression count that makes every visual-search project successful. Agree on the decision you need to make and the evidence needed to make it before the reporting meeting.
What does a practical Indian ecommerce example look like?
Hypothetical example — not a Digi Amenity client result: A home-decor retailer sells table lamps across India. Its team compares the same product-page group in India on mobile across two complete seven-day periods.
The earlier period contains 800 multimodal impressions and 16 clicks; the later period contains 1,200 impressions and 18 clicks. CTR moves from 2% to 1.5%. Exposure increased by 50%, but clicks increased by only 12.5%. Calling this simply “better performance” would hide the difference between reach and response.
The team should first inspect whether new pages entered the group or the impression mix changed. It should then examine product availability, image-to-page relevance and the mobile destination. The lower CTR does not prove that the photographs deteriorated.
Suppose analytics records four purchases on those pages from all channels during the later period. It would be incorrect to divide four purchases by the 18 Search Console clicks and call the result a multimodal conversion rate. The numerator and denominator describe different populations.
A sensible next action is to select a small, stable set of in-stock lamp pages, document one improvement, note promotion and price changes, and review the next comparable period. A simple before-and-after comparison remains observational; it is not a controlled experiment.
Which image and page improvements are worth checking?
Google’s image SEO guidance supports a practical foundation: discoverable HTML images, a fallback src for responsive images, useful alt text, relevant surrounding copy and a balance between image quality and loading performance. CSS background images are not indexed as images.
For a product catalogue, check whether the photograph accurately represents the available item and variant. A compelling room scene is less useful if the customer cannot identify which lamp is for sale. Put dimensions, material and other decision-making details in readable page text too.
Use our product photography guide for ecommerce to plan images around customer questions. Prioritise useful views and accurate representation over producing a larger volume of decorative images.
For eligible product pages, review Google’s Product structured-data guidance. Keep markup, visible price, availability and product information consistent. Product markup can support eligible search appearances; valid markup does not guarantee visibility.
Finally, inspect the full mobile journey from landing page to purchase or enquiry. Our web development services connect page structure, performance, forms and checkout implementation. A reporting improvement only becomes commercially useful when the destination can serve the visitor.
What should your team record in its reporting worksheet?
Use one row per page group and reporting period. Keep missing values blank with a reason. The following worksheet is designed to make a decision reviewable, rather than to generate a single score.
| Worksheet field | What to record |
|---|---|
| Scope | Property, canonical page or page group, country, device, search type and extraction date |
| Period | Start/end dates, comparison dates and whether both periods have complete available data |
| Search evidence | Reported impressions, clicks, calculated CTR and available position; retain the raw export |
| Business context | Stock, pricing, promotions, site releases and other campaigns affecting the same pages |
| Outcome evidence | Landing-page analytics and verified orders or qualified enquiries, with attribution limitations |
| Decision | Keep, improve, expand or investigate; include the evidence and unresolved questions |
| Accountability | One owner, a specific action, implementation date and remeasurement date |
Before sharing the worksheet, check the original UI against exported blanks and zeros. Google notes that some unavailable values can appear as zero in exports. Also avoid summing every displayed page row and assuming it must match a property-level chart: aggregation and reporting limits can differ.
How should you review the first month?
Use the first week to confirm availability, capture the baseline and audit a small set of commercially relevant pages. In the second week, fix a verified measurement or destination problem and record the exact change. Use the remaining weeks to collect comparable observations, with promotion and stock changes noted.
At the month-end review, choose one of four outcomes: keep the current approach because the evidence is adequate; improve a specific weakness; expand a promising test cautiously; or investigate an unresolved issue. If the sample remains too small, extend the observation window and say so.
If your team can see visual-search exposure but cannot connect it to useful landing pages and credible business outcomes, Digi Amenity can review the Search Console setup, image context, conversion measurement and mobile journey through a focused SEO review before you commit to a wider content or photography project.
Frequently asked questions
Is Google Search Console multimodal reporting available in India?
Google announced a global rollout. Check the Search type options in your own property and whether there is reportable activity for your selected dates. Availability of the filter and having enough useful data are separate questions.
Is the Multimodal filter the same as the Images filter?
No. The multimodal view concerns searches involving an image as input. The Images view concerns image-search results. Record which view you used so that the team does not compare different experiences as though they were the same channel.
Can I see the exact image or keyword a customer searched with?
Do not expect the report to provide a customer’s uploaded photograph or a conventional multimodal keyword list. Google documents that the Queries dimension is unavailable for multimodal reporting. Use page-level patterns without inventing the missing query detail.
Does the report prove that Google Lens generated a sale?
No. Search visibility and clicks are different from verified orders. Compare landing-page analytics and business records for context, and state where individual journey attribution is unavailable. A rise in both metrics is not proof that one caused the other.
Should every business invest heavily in Google Lens SEO?
Prioritise according to the product, customer behaviour and available evidence. Visually distinctive products may justify a focused investigation. A business selling a complex service should first establish whether relevant pages receive useful exposure before reallocating its budget.
Do better images or Product structured data guarantee visibility?
No. Accurate photography, accessible pages and appropriate markup are useful foundations. They do not create a guaranteed placement or ranking. Avoid proposals that promise a specific volume of Lens traffic without evidence.
How often should we review multimodal search performance?
Start with a regular weekly check for reporting availability and problems, then use a longer decision window when volume is low. Keep dates, countries, devices and page groups consistent. Revisit the plan after enough complete data exists to assess the action responsibly.